


Flight International’s annual airliner census has tracked the industry’s many booms and busts over the several decades it has been published, but never on a scale seen in 2020.
Flight International’s annual airliner census has tracked the industry’s many booms and busts over the several decades it has been published, but never on a scale seen in 2020.
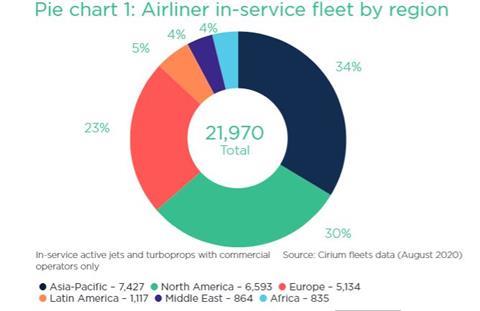
The change in headline numbers, according to Cirium fleets data, provides a simple illustration of the coronavirus effect: the global in-service airliner fleet has declined by 25% from 29,500 jet and turboprop aircraft when last year’s census was published in mid-2019 to just under 22,000 this August.
The scale of this decline in the active fleet caused by the coronavirus pandemic is of course unprecedented. The highly fluid situation with regards the status of the operational fleet called for a change to our usual method of analysis. The census traditionally focuses on the in-service operational airliner fleet, but with such high proportions of each type in temporary storage this year the parked aircraft are being included as part of the analysis.
The first nine months of 2020 have been extraordinary for the airline sector as measured by so many metrics. The active fleet has plummeted and deliveries of new aircraft have all but stalled amid the collapse in demand for air travel, combined with the complications caused by lockdowns and quarantines hampering the delivery process.
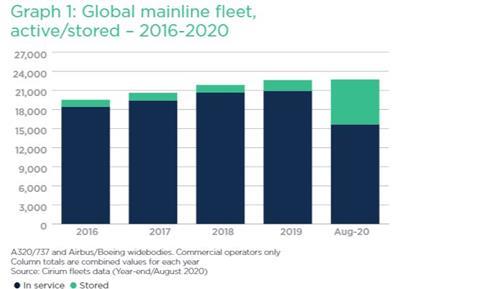
Until 2020, the active global airliner fleet had been steadily increasing each year through the 2010s, before growth began trailing off in 2019. Evaluation of the global mainline airliner fleet – that is the single-aisle Airbus A320 and Boeing 737 families along with Airbus/Boeing widebody types – reveals the comparative effect of the crisis on the number of aircraft in active service.
Traditionally, the number of stored aircraft equates to about 6-8% of the total fleet. As Graph 1 illustrates the year-end situation over the last five years and in August 2020. The active fleet had been steadily increasing from 18,400 aircraft in 2016 to 20,900 last year, before declining to 15,600 in August 2020. The effect of Covid-19 had resulted in the stored fleet ballooning to around 31% of the total fleet.
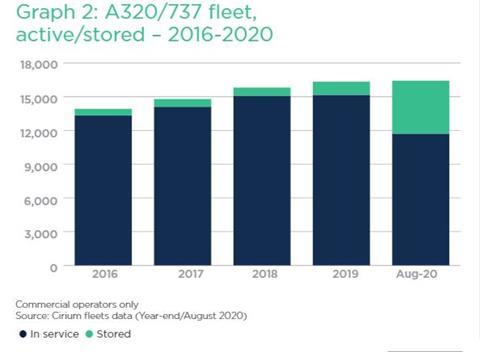
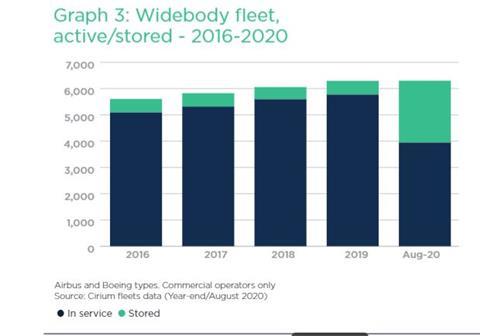
Graph 2 shows the evolution of the A320/737 active/stored fleet over the and graph 3 illustrates the situation with widebodies.
A closer look at 2020 reveals the dynamics that have played out in changes to the active fleet.
At 1 January 2020, the mainline Airbus and Boeing fleet in active service with commercial operators totalled almost 20,800 aircraft. The active fleet began an immediate decline in January, falling to a low of around 9,000 aircraft (a 56% drop) in the April/May period. By September, this figure had increased to over 16,100 aircraft, but was still down over a fifth on the size at the start of the year.
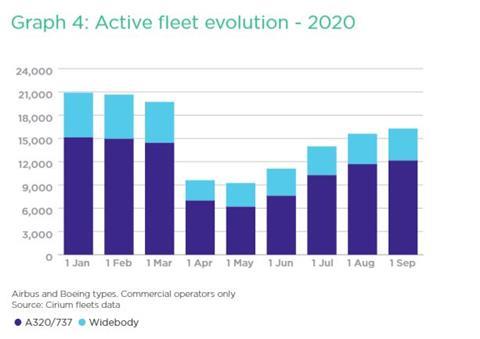
It is evident from the recovery profile that the active single-aisle fleet is rebuilding faster than the widebodies. By September the A320/737 fleet was within 20% of the size at the start of the year, while widebodies were still down by 28%, highlighting how short-to-medium operations have been recovering faster than longer-haul services.
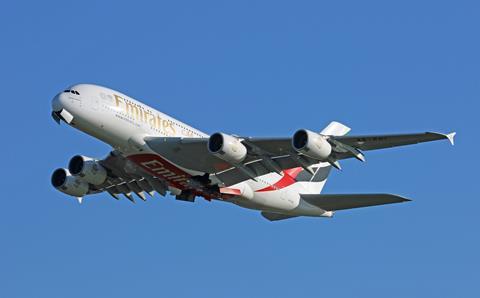
There will be casualties in both the single- and twin-aisle sectors but it is already clear that the four-engined widebodies are most at risk. It is clear that the size of the Boeing 747 passenger fleet has been irreversibly reduced, and the outlook for the A380 is tough – with several airlines having decided to permanently retire some or all their aircraft. Other operators have no near-term plans for a return to service.
WHEN WILL GLOBAL FLEET RECOVERY HAPPEN?
The pace of recovery of the active fleet to its pre-Covid size is tough to judge given there are so many dependable factors, says Ascend by Cirium’s head of global consultancy, Rob Morris: “There is no single panacea for any of this, but I suspect that the key is implementation of a successful vaccination programme on a global scale.”
And the size of the fleet is only one metric by which to measure the industry’s gradual return to the old normal, with the others being the utilisation of the fleet and of course the load factors. Morris points out that the former is currently down significantly, compared with the start of 2020.
The general consensus across the industry is that a full recovery will only be possible once a vaccine is introduced to allow social distancing and travel restrictions to be relaxed, making the short-to-medium term outlook difficult to forecast. Emirates Airline president Tim Clark describes social distancing on aircraft as “an economic catastrophe. Airline business models are not built on 50% seat factors for no segment of the business. So that can’t work.”
Clark says that a vaccine “must be found” for the industry to recover fully, but he is “100% confident” it will be.
Clark also believes that once a vaccine is found there should be a bright future for the A380, of which Emirates has 115: “The A380 has proven to be a hugely successful aircraft and if fuel prices were forever to stay at today’s levels, this aircraft is hugely potent,” he says. “The thirst for travel will come back.”
“We aren’t expecting traffic to return to the 2019 peak until late 2023 – in fact IATA now says 2024. And, until there’s a vaccine next year – we hope – the traffic recovery will be a bit anaemic,” says
Says Richard Aboulafia, vice-president of analysis at Teal Group.
“So, since the fleet is coming back faster than traffic, it’s clear that the result will be financial pain for the airlines, particularly if more government aid isn’t forthcoming.
“In short, the best case scenario is that the fleet stabilises at around this level for the next 6-12 months, and it’s also possible that more planes are grounded, depending on traffic and aid packages.”
Morris says that the in-service fleet (defined as aircraft tracked flying – single-aisle and twin-aisle in passenger and cargo operations) has recovered to some extent but has reached only around two-thirds of that flying at the start of 2020. “The recovery has stabilised around this level and as we now head into the northern autumn and winter, it is hard to see further significant recovery in 2020,” he says.
Morris and Aboulafia concur that the “two-speed recovery” being witnessed in the mainline fleet sector will continue.
“Twin-aisles are much more vulnerable to prolonged parking, and Airbus is generally in better shape, since the A321neo and A220 would appear to be relatively well positioned,” Aboulafia says.
Morris says that, based on the assumption that single-aisles typically serve domestic and regional markets while twin-aisles are deployed internationally, fortunes will be affected by the different speeds at which these markets recover.
“At present we are seeing around 70% of the global single-aisle passenger fleet back in service but only around 40% of the twin-aisle,” he says.
“Looking further forward, our current most likely recovery scenario (which projects global passenger demand to recover to 2019 levels in 2023 – which may itself prove optimistic) has the global single-aisle fleet recovering to end 2019 levels at some point in late 2022, with twin-aisle not recovering to those levels before end 2023 at the earliest, and potentially later.”
Ascend by Cirium’s projection comprises many assumptions, including recovery of demand itself, recovery of passenger load factor, recovery of aircraft unit utilisation and a change in the mix between twin-aisle and single-aisle. “Clearly, these variables will alter the timing. But overall it is abundantly clear that single-aisle will recover ahead of twin-aisle,” Morris states.
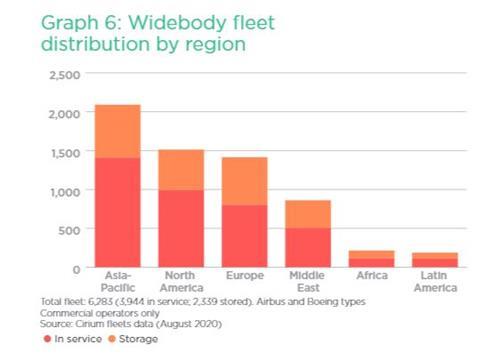
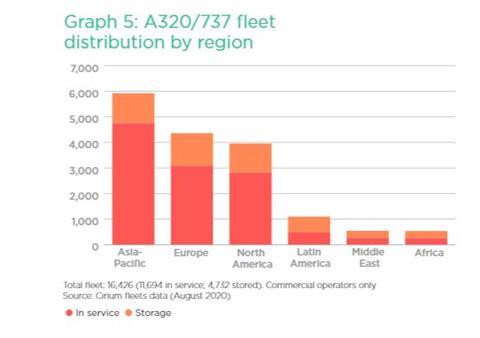
Graphs 5 and 6 show the geographic breakdown in August of the mainline types – A320/737 and widebodies, respectively. The split between active and stored aircraft varies between region, but this has been an ongoing dynamic situation throughout 2020 and will continue as such.
The top 10 fleets rankings from Cirium are also revised this year. Normally the metric is based on active aircraft, however this year the stored totals are included as they account for such large numbers, along with the share of the fleet that is active.
| Type | In service | Storage | Total | Active share |
|---|---|---|---|---|
| Airbus A320ceo family | 4,919 | 2,279 | 7,198 | 68% |
| Boeing 737-600/700/800/900 | 5,072 | 1,420 | 6,492 | 78% |
| Boeing 777 | 1,006 | 509 | 1,515 | 66% |
| Airbus A330ceo/A340 family | 731 | 747 | 1,478 | 49% |
| Airbus A320neo family | 1,152 | 225 | 1,377 | 84% |
| Boeing 737-200/300/400/500/ | 551 | 425 | 976 | 56% |
| Boeing 787 | 700 | 265 | 965 | 73% |
| Boeing 767 | 528 | 272 | 800 | 66% |
| Boeing 757 | 465 | 250 | 715 | 65% |
| Boeing 747 | 324 | 173 | 497 | 65% |
| Source: Cirium fleets data (Aug 2020) Commercial operators only | ||||
The A320ceo is ranked first in the mainline group by total fleet – although notably there are currently more 737NGs in active service currently even though the total fleet is smaller. The 737 Max had been on course to break into the top 10 but deliveries were suspended in March 2019 following the fleet grounding. The uncertainty around when the 737 Max will be cleared to return to service and deliveries will restart is another factor in the difficulties in forecasting the pace of the fleet recovery.
The highest proportion of any fleet flying is the A320neo – at 84%, with the 737NG a close second on 78%. In the widebody arena it is the 787 that is the most numerous proportionally – at 73%. This highlights how airlines are favouring the youngest, most-efficient types as they gradually restore the fleets to service.
The Embraer E-Jet again tops the regional aircraft fleet ranking, with the ATR turboprop family in second place.
| Type | In service | Storage | Total | Active share |
|---|---|---|---|---|
| Embraer 170/175/190/195 | 1,034 | 457 | 1,491 | 69% |
| ATR 42/72 | 763 | 446 | 1,209 | 63% |
| Bombardier CRJ700/900/1000 | 595 | 248 | 843 | 71% |
| Embraer ERJ-135/140/145 | 320 | 366 | 686 | 47% |
| Bombardier CRJ100/200 | 288 | 389 | 677 | 43% |
| De Havilland Canada Dash 8-400 | 337 | 216 | 553 | 61% |
| Bombardier Dash 8 Q100/200/300 | 275 | 160 | 435 | 63% |
| Beechcraft 1900 | 283 | 101 | 384 | 74% |
| De Havilland Canada Twin Otter | 235 | 133 | 368 | 64% |
| Fairchild Swearingen Metroliner | 218 | 44 | 262 | 83% |
| Source: Cirium fleets data (Aug 2020) Commercial operators only | ||||
Graph 7 highlights the slowdown in orders for Airbus and Boeing types that began last year after the backlog peaked in 2018. This was also a factor of the increasing output across the assembly lines which had been continuously breaking industry records until the 2019 Max grounding sent Boeing’s shipments tumbling.
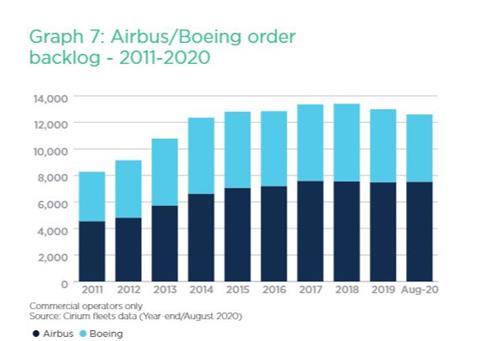
Orderbook restructuring has been an ongoing theme, partly linked to the Max crisis and also the wider industry downturn. The effect on the Max orderbook is already clear to see in graph 7, which highlights its declining backlog – against zero deliveries for the last 18 months, compared with a static situation for the A320neo.
The intake of new orders at Airbus and Boeing has also slowed dramatically but so have delivery levels so it will be interesting to see where the backlog finishes up once at the end of 2020 once all the pieces slot into place.
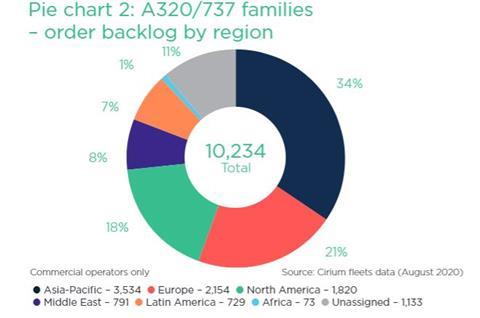
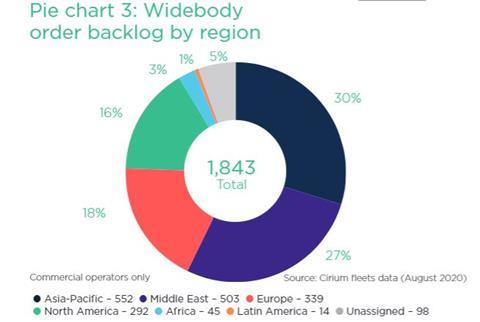
The two orderbook pie charts illustrate the breakdown by region of the A320/737 and widebodies for commercial operators. As ever, Asia-Pacific is the lead region with a 34% and 30% share of the orderbooks, respectively. Europe is the second-largest region in the single-aisle sector while the Middle East is in the equivalent position for widebodies.
Supporting documents
Click link to download and view these filesWorldAirlineCensus2020
PDF, Size 1.95 mb