


All AB Power BI story articles
View all stories of the same content type.
-
 AB Power BI story
Week 50 2024: Will airline profits beat 2023 performance?
As 2024 nears its end, thoughts are turning to how the airline industry has performed in financial terms versus expectations as the year began
-
 AB Power BI story
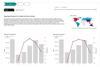
Traffic and capacity
Our traffic and capacity dashboard combines the key data from our benchmark airlines/groups that report quarterly, providing macro insights on the industry’s performance at a regional and global level STATUS: Q3 2025 data complete for all regions and global. Annual 2025 data in progress for all regions and global.
-
 AB Power BI story
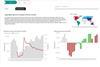
Financials
Our financials dashboard combines the key data from our benchmark airlines/groups that report quarterly earnings, providing macro insights on the industry’s performance at a regional and global level STATUS: Q3 2025 data complete for all regions and global. Annual 2025 data in progress for all regions and global.
-
 AB Power BI story
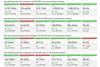
Indicators
The latest data for several key airline market indicators, including share-price developments, long-term fuel-price trends, and headline financial and traffic figures from our group of benchmark airlines for the latest completed earnings period. Traffic and capacity data from IATA further broadens understanding of industry trends