


The US majors as a group halved their net losses last year to $500 million, while the 28 non-US carriers for which we have interim figures turned around from a combined net loss of $1.3 billion in 1993 to a net profit of $1.8 billion in 1994.
However, all these figures come with caveats. The US results are confused by bankruptcies and restructuring. Continental recorded a net profit of $2.6 billion in 1993, but this was entirely due to its adoption of 'fresh start' accounting upon its emergence from Chapter 11; before that it lost $1 billion on operations. For the purposes of this table, we have not enumerated a 1993 net result for Continental. In 1994's figures, Continental has estimated a restructuring charge of $400 million but will not release a final figure until March. In addition, TWA's entry only covers the first nine months of 1994, as its final year figures were not available at press time.
The results table for the non-US carriers has to be qualified by the fact that most do not cover a full year. This table includes 10 carriers which had years ending between March and October, plus two which have released preliminary figures for years ending in December. But the rest of the results in this list are interim half-year or nine-month results, and may therefore be distorted by seasonal factors.
Both tables tell a tale of variable fortunes. In the US, Alaska Air, American, America West, FedEx, Northwest and, to a degree, United, turned in a much improved performance and registered net profits - although in the cases of American and United particularly, these profits cannot be described as healthy.
Northwest's record year produced operating earnings of $830 million and a net profit of $295.5 million, replacing Southwest as the most profitable US carrier. American's result included a special charge of $278 million for layoffs, and United achieved $521 million in operating income though its net profit was cut back by the July recapitalisation and an accounting change.
Delta made a $197 million operating profit but was pushed into the red by a restructuring charge of $414 million. TWA reduced its losses in the nine months; its year-end figure is not known yet. Continental underwent further restructuring, resulting in another big loss.
At the bottom of the pile troubled USAir added $685 million to its $393 million loss in 1993. USAir's loss includes a $226.1 million one-time charge, mostly made up of reserves for grounded aircraft and obsolete inventory. The carrier's operating performance is more worrying; it was the only US major not to improve its operating performance, sliding from an operating loss of $95.8 million in 1993 to $491.4 million in 1994. Factors working against USAir include a lack of agreement with unions on cost-cutting, the knock-on effect of two accidents, and a 9.6 per cent drop in yields as a result of competition.
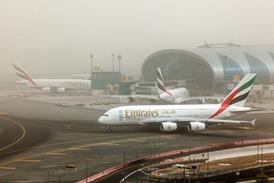
Outside the US, in their full financial years both Ansett and Qantas turned the corner, and Thai Airways International, Emirates and Air New Zealand improved their profits substantially.
Among the carriers reporting nine-month figures, the red ink largely disappeared as Air Canada, Lufthansa, PWA, SAS and Varig all returned profits. These five carriers earned $616 million between them, while in the same period in 1993 they lost $728 million, representing a turnround of $1.3 billion just for these five airlines. Also in this section, KLM more than doubled its profit and British Airways increased its profit by over 30 per cent.
The half-year results show more variation. Japan Airlines moved from loss to profit and there were increased profits at Cathay Pacific, Finnair, Malaysia Airlines and SIA. But Air France, Alitalia, Iberia and Swissair only managed to reduce their losses. However, the second half contains the peak of activity for all these airlines.
Traffic grew steadily in 1994 and most airlines improved their load factors. Even though yields were under pressure, rising load factors indicate that there may be less pressure on yields in the future, assuming demand remains buoyant.
The US majors registered a 4.3 per cent increase in revenue passenger km, with an increase of 4.9 per cent domestically but only 2.6 per cent growth in international markets. However, the US carriers have improved their ability to tailor capacity with demand, and load factors increased by 2.9 percentage points to 66.5 per cent.
Four US carriers achieved considerable load factor gains - American's load factor was up 4.4 points, United's 4.0 points, Delta's 3.9 points and USAir's 3.0 points. This is a good sign, but load factor improvements achieve little if they are at the expense of yields. Furthermore, there is a considerable gulf in load factor performance, with United turning out a creditable 71.1 per cent but USAir trailing the pack at 62.2 per cent despite an improvement.
While there are many other factors to take into account, it is noticeable that the carriers with below-average load factors, including USAir, Continental and TWA, were those that turned in the poorest financial performances.
Southwest remained the fastest growing US major, registering RPK growth of 14.8 per cent even after adding in Morris Air's results for 1993, the year it was acquired by Southwest. Southwest now has 4.5 per cent of the US majors' RPKs, giving it a market share approaching TWA's and not too far behind Continental's and USAir's.
The international traffic figures were disappointing. USAir's decline resulted from a transferral of traffic to its partner British Airways, and Continental cut back on international flying. Northwest's small traffic reduction may signal a transfer of traffic to KLM. There are now only four US carriers with substantial international traffic. United and American account for more than half of the US majors' international traffic, with Northwest and Delta carrying another 35 per cent.
The 23 non-US majors in the sample which have reported 11-month or 12-month traffic so far have grown by an overall 3.3 per cent in passenger numbers and 5.1 per cent in RPKs, with freight tonne km advancing by 11.5 per cent.
The fastest growing non-US carriers in RPK terms were Turkish Airlines (19.6 per cent), Sabena (15.6 per cent), Cathay Pacific (12.5 per cent) and KLM (10.2 per cent). China Airlines' traffic dropped following an accident, and Philippine Airlines lost ground internationally. Qantas lost some domestic market share to Ansett, reducing passenger numbers but having little effect on RPKs. Iberia and TAP Air Portugal also suffered traffic declines.
Booming freight markets helped several major airlines, with Turkish Airlines, China Airlines, Cathay, SIA and KLM all growing by more than 15 per cent. However this was often at the expense of falling yields.
The Association of European Airlines hailed 1994 as a 'vintage year in terms of capacity and traffic development.' The 24 AEA carriers increased their RPKs by 9 per cent, but held capacity growth to 4.9 per cent, creating a welcome 2.6 point increase in load factors, which reached the record level of 69 per cent. The AEA carriers' FTK growth was 13.9 per cent, the best for 10 years. South America and the Far East produced the best growth overall. Intra-European RPKs grew by an above average 9.6 per cent, although there is still scope for improving load factors beyond last year's 60.7 per cent.
The Association of European Airlines hailed 1994 as a 'vintage year in terms of capacity and traffic development.' The 24 AEA carriers increased their RPKs by 9 per cent, but held capacity growth to 4.9 per cent, creating a welcome 2.6 point increase in load factors, which reached the record level of 69 per cent. The AEA carriers' FTK growth was 13.9 per cent, the best for 10 years. South America and the Far East produced the best growth overall. Intra-European RPKs grew by an above average 9.6 per cent, although there is still scope for improving load factors beyond last year's 60.7 per cent.
Source: Airline Business