


FlightGlobal is the global aviation community’s primary source of news, data, insight, knowledge and expertise. We provide news, data, analytics and advisory services to connect the aviation community globally and help organisations shape their business strategies, identify new opportunities and make better decisions faster.
- News
- Airlines
- Defence
- Flight International
- Events & webinars
- Jobs
- Subscribe
- Airline Business
 Azul seeks to leave disruptions of early 2020s behind in post-bankruptcy era
 Strong air travel demand offsetting surging jet fuel prices for US carriers
 Southwest not ‘copying’ rival US airlines with assigned seating and baggage fees: CEO Jordan
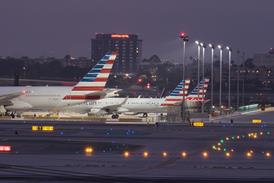 American expects profit jump in 2026 despite early weather-related setback